Insights · Operations
Your sales history only counts the days you had it
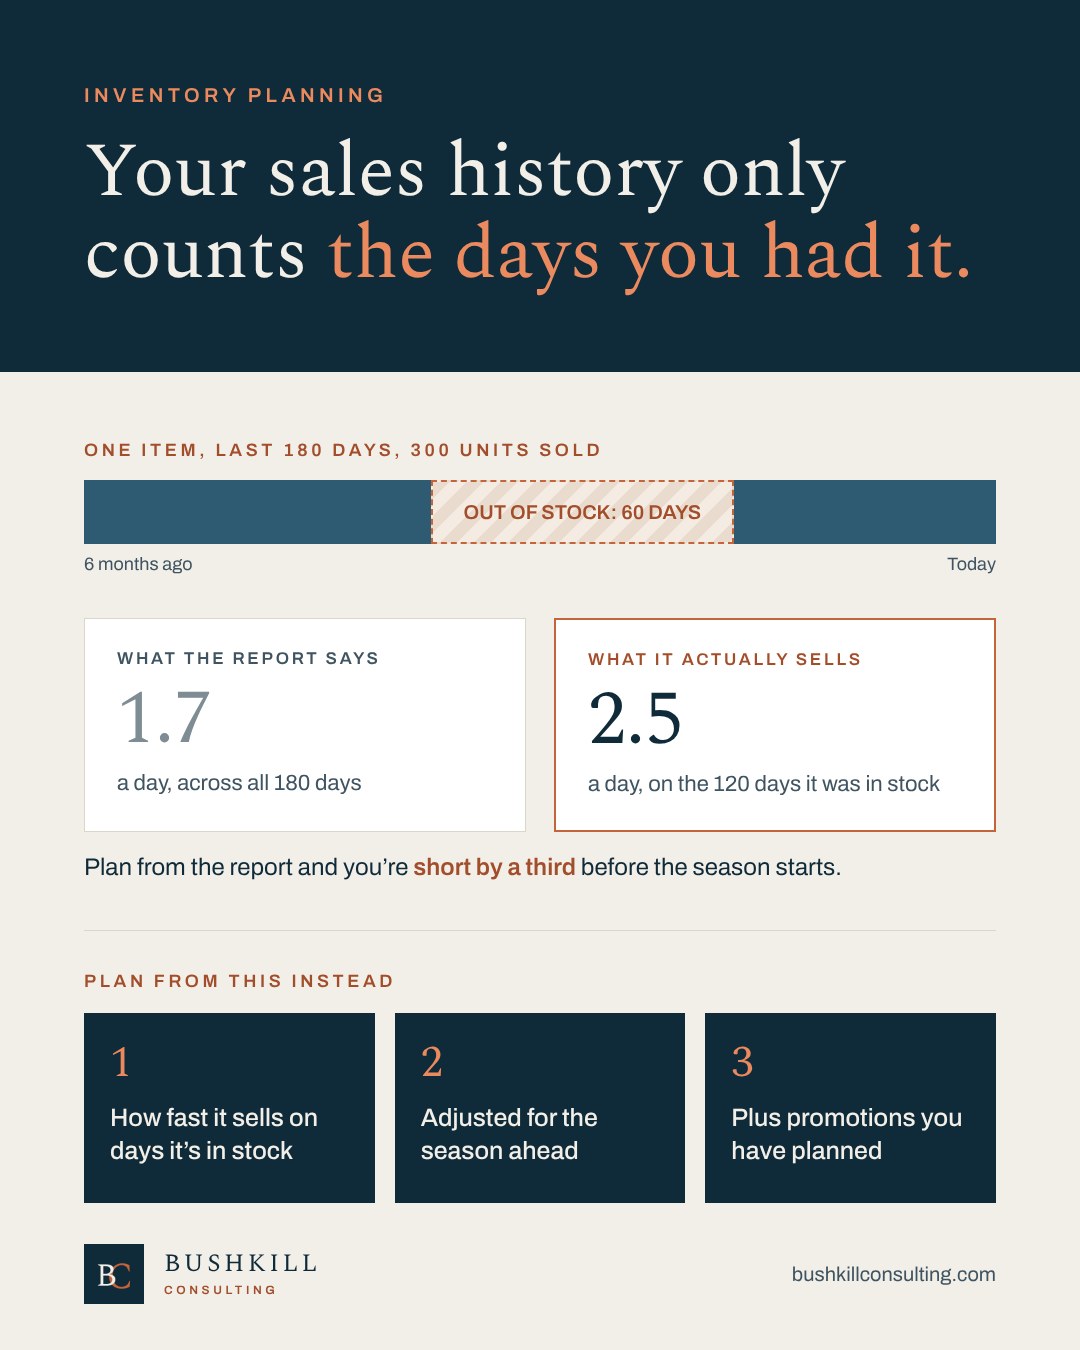
Most buying plans start with one number: what we sold in the last six months. Divide by the days, multiply by the weeks of cover you want, subtract what's on hand, and place the order.
It's quick, and it's wrong in both directions.
What the report leaves out
Your sales history only records the sales you were able to make. If an item was out of stock for two of the last six months, the report shows the demand you could fill, not the demand you actually had.
Take one item. It sold 300 units over the last 180 days, which works out to 1.7 a day. But it was out of stock for 60 of those days. On the 120 days it was actually on hand and sellable, it sold 2.5 a day.
Order from the report and you're a third short before the season starts. Then the item stocks out again, the next six months of history look weak again, and the next order comes in short again.
It misleads the other way too
The same six-month window can make other items look busier than they are. If it includes the holidays, or a big promotion that pulled a month of demand into one week, an ordinary month gets planned like a peak one.
That's where a lot of aged inventory comes from: orders sized off a stretch of weeks that isn't going to repeat.
Need a hand with this? I've planned inventory this way since 2014, and I can run your numbers through the same tool. Let’s talk →
Plan from three things instead
1. How fast it sells on the days it's in stock
Count only the days the item was on hand and sellable, meaning available to a customer, not reserved, damaged or sitting in receiving. Divide sales by those days. That's the item's real rate of sale, and it's usually higher than the report suggests for your best sellers.
2. How that changes with the season
November doesn't sell like March. Compare each item, or at least each category, to the same weeks last year and build a simple seasonal index. Then apply it to the weeks you're actually buying for, not the weeks you just had.
3. What's coming up
Promotions, launches, holidays and catalog drops all pull demand forward. Your last promotion tells you roughly how much lift to expect. Your promotional calendar tells you when. If a promotion is planned and the buy doesn't reflect it, one of them is wrong.
Where I've used it
I built my first version of this projection tool in 2014 and have used it ever since. It has rightsized inventory at four different companies, on the direct-to-consumer side and on the B2B side supplying retailers.
At one of them, rebuilding the buying cadence around it cut aged inventory in half while in-stock improved at the same time.
Before your next order
You don't need a new system to start. For your top twenty items, pull the days each one was out of stock in the last six months and recalculate the rate of sale on in-stock days only. Then check whether the window you're using includes a holiday or a promotion that won't repeat. Then put your promotional calendar next to your open orders.
If you're placing holiday or first-quarter orders off last year's sales report, start with the items that were out of stock for part of it. Those are the ones the report is most likely to get wrong.
See what the tool does with your inventory
Send me your top items and the last six months of sales. I'll run them through the projection tool and show you which ones your report is undercounting and which it's overstating.